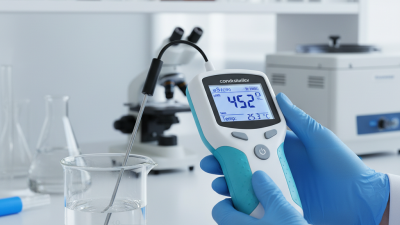
Choosing the right conductivity meter for water requires more than comparing screen size, price, or advertised accuracy. The WHO/UNICEF Joint Monitoring Programme reported that 2.2 billion people lacked safely managed drinking water in 2022. Reliable field testing therefore remains practical, not decorative. Conductivity helps indicate dissolved ionic substances, salinity changes, and possible treatment problems. However, it does not identify every contaminant. That limitation matters.
This Top 10 guide evaluates meters against recognized technical expectations, including measurement range, temperature compensation, calibration control, probe durability, and data handling. ISO 7888 defines a standard method for determining electrical conductivity in water. The U.S. Geological Survey also explains that conductivity changes with temperature and dissolved mineral content. A quality instrument should therefore display temperature, support appropriate calibration standards, and produce stable readings in a glass, tank, or flowing sample line. Look for clear evidence.
The selected models are compared for drinking-water checks, aquariums, hydroponics, laboratories, and industrial monitoring. Some meters excel in portability, while others provide stronger documentation and replaceable probes. No single model fits every user. That is easy to overlook.
A practical test includes rinsing the probe, avoiding air bubbles, waiting for a steady value, and recording the water temperature. Even expensive meters can mislead when electrodes are dirty or calibration is rushed. This review combines manufacturer specifications with established water-quality guidance, while recognizing that product claims still require independent verification. The ranking is useful, but not absolute. Conditions change.
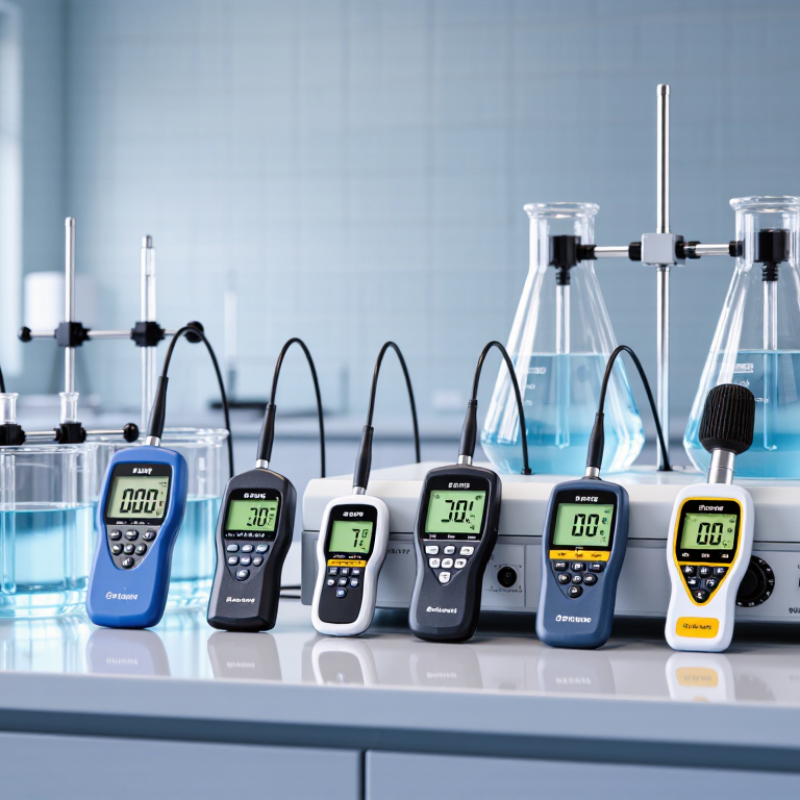
Water conductivity measures how easily dissolved ions carry an electrical current. It is reported in microsiemens per centimeter (µS/cm), usually corrected to 25°C. The U.S. Geological Survey explains that conductivity changes with dissolved minerals, temperature, and wastewater inputs. A sudden rise can signal contamination, salt intrusion, or treatment failure. It cannot identify the pollutant.
That limitation matters. The World Health Organization’s 2022 drinking-water guidelines describe total dissolved solids as mainly a taste concern, with water below 600 mg/L generally rated acceptable. The U.S. Environmental Protection Agency lists 500 mg/L as a secondary standard for total dissolved solids. Conductivity can estimate dissolved solids, but the conversion varies by water chemistry. One fixed formula is not enough.
A useful meter should offer automatic temperature compensation, stable calibration, and a probe suited to the sample. Keep calibration records. Rinse the sensor after every measurement, especially after testing hard or saline water. A reading near 300 µS/cm may be normal for one source and unusual for another. Context is essential.
Meters are not magic. They provide an early warning, not a complete water analysis. For serious decisions, pair conductivity readings with pH, turbidity, and laboratory ion testing. Some low-cost instruments drift more than expected, and even careful users can trust a clean display too quickly. That is worth questioning.
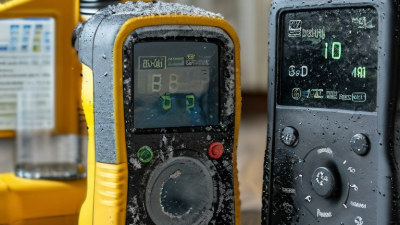
When comparing conductivity meters, measurement range should match the water source. Pure water may read below 5 µS/cm, while wastewater can exceed 10,000 µS/cm. A narrow range creates avoidable errors. ASTM D1125 and ISO 7888 emphasize cell selection, calibration, and temperature control. Look for automatic temperature compensation, but verify its reference temperature. Many instruments assume 25°C.
Accuracy matters more than impressive resolution. A display showing 0.1 µS/cm is not useful if accuracy is ±2%. The 2022 WHO Guidelines for Drinking-water Quality classify total dissolved solids below 300 mg/L as excellent for taste, while levels above 1,200 mg/L are generally unacceptable. Conductivity does not equal TDS, though a meter may estimate it using a conversion factor. That estimate changes with water chemistry.
Field users should inspect probe stability, response time, cable strength, and waterproofing. A clear calibration reminder helps during repeated sampling. Data logging and export functions also support traceability under regulated laboratory procedures. Check whether the meter accepts certified conductivity standards, not only generic solutions. Short tests help.
A practical comparison should include uncertainty, temperature drift, battery life, and cleaning effort. I would question any specification tested only under ideal laboratory conditions. Real samples contain oils, bubbles, and suspended solids. Even experienced operators can misread a stable number. Record the sample temperature and rinse the cell between measurements.
Choosing among the top 10 conductivity meters for water requires more than comparing screen size. A reliable meter should offer automatic temperature compensation, selectable cell constants, calibration reminders, and a readable display in bright field conditions. ISO 7888 recommends conductivity measurement procedures that control temperature and electrode performance. For drinking water, the US EPA lists 500 mg/L as a secondary standard for total dissolved solids. Conductivity does not equal TDS, though. Conversion depends on the water chemistry.
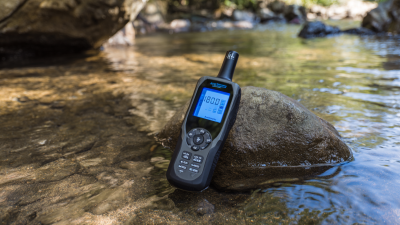
Use matters. A pocket meter suits quick checks in aquariums, hydroponic tanks, and household filters. A waterproof handheld model works better beside wells, cooling systems, and treatment lines. Benchtop instruments provide greater stability for laboratories and process control. Look for a measurement range that matches the sample. Ultra-pure water needs a sensitive low-conductivity sensor, while saline water demands a wider range and corrosion-resistant materials.
Field experience exposes small weaknesses. Wet connectors, trapped air, and dirty cells can distort readings within seconds. I prefer models with replaceable probes and clear calibration records. Not every automatic feature helps. Some meters hide unstable readings behind fast updates. The WHO Guidelines for Drinking-water Quality, 2022, do not set a health-based conductivity limit, because dissolved substances vary widely. That detail matters. Conductivity is a screening signal, not a complete safety test. Even experienced users can overinterpret it.
Choosing among the top 10 conductivity meters for water in 2026 starts with the sample itself. Purified water needs a sensitive meter with a low conductivity range. Drinking water usually requires stable readings across moderate mineral levels. Wastewater demands a wider range, durable housing, and simple cleaning. Seawater needs corrosion-resistant materials and reliable temperature compensation. Hydroponic water benefits from quick readings and clear calibration reminders.
Match the meter’s cell constant to the expected conductivity range. A low cell constant suits ultrapure samples, while a higher constant handles salty or heavily contaminated water. Check temperature compensation carefully. A reading taken beside a cold storage tank may differ greatly from one taken outdoors. Automatic compensation helps, but it cannot correct a dirty probe or poor sampling technique.
In field inspections, I prefer meters with replaceable probes, readable displays, and documented calibration procedures. Two-point calibration can improve confidence when the sample range is broad. Rinse the probe with clean water between tests. Then remove excess droplets without wiping the sensor harshly. Small details matter.
Do not trust every stable number.
A meter may display steady values while the probe coating slowly affects accuracy. Verification with a certified reference solution remains important, especially for laboratory records. Data logging is useful for repeated measurements, though it can create false confidence if users ignore sampling conditions. Consider battery life, waterproof protection, service support, and measurement resolution before choosing from the list. The most expensive model is not always the most suitable one.
Typical electrical conductivity values for common water types at approximately 25°C. Use these ranges to match a meter’s measurement range, resolution, and temperature compensation capability to the water being tested.
Conductivity is shown on a logarithmic scale in microsiemens per centimeter (µS/cm). Ultrapure and distilled water require highly sensitive low-range meters, while brackish, seawater, and saline water require instruments with much higher upper-range limits. Actual readings vary with temperature, dissolved minerals, treatment processes, and contamination.
Top 10 Conductivity Meters for Water in 2026
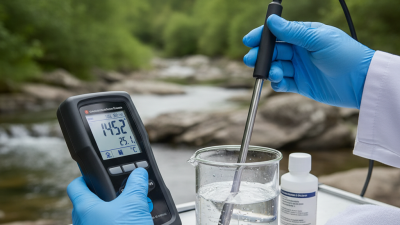
Accurate conductivity readings begin with proper calibration, not a quick button press. Use a certified conductivity standard near the sample’s expected range. Check its expiry date, temperature, and container cleanliness. Rinse the probe with deionized water, then gently shake away droplets. Do not wipe the sensor aggressively; tissue can leave fibers or create static effects. Immerse the cell fully, keeping it away from the beaker walls. Wait for a stable value before confirming calibration. Record the standard, temperature, date, and operator in a simple log.
Testing should match the water’s purpose. Take a fresh sample in a clean glass or plastic vessel, and measure promptly. Temperature compensation can improve comparisons, but it cannot repair a contaminated sensor. Compare unusual results with a second calibrated meter or a known control sample. If readings drift, inspect trapped air bubbles, loose cables, and salt deposits. I have found that rushing the rinse step often causes more trouble than the meter itself. That assumption is easy to miss.
Tips: Calibrate at the working temperature when possible. Use separate containers for standards and samples. Store the probe according to its instructions, never dry by guesswork. After each session, rinse it, inspect the cell, and document anything unusual. Replace damaged cables or cracked sensors promptly. A small maintenance note today can prevent a questionable water result tomorrow.
| Rank | Meter Profile and Best Use | Conductivity Range | Resolution | Typical Accuracy | Temperature Compensation | Recommended Calibration | Testing Procedure | Maintenance Procedure | Ingress Protection | Service Interval |
|---|---|---|---|---|---|---|---|---|---|---|
| 1 | Laboratory benchtop meter for ultrapure and purified water | 0.055 µS/cm to 200.0 mS/cm | 0.001 µS/cm at the low range | ±0.5% of reading or ±0.01 µS/cm | Automatic, 0–100°C; use a low-conductivity flow cell when required | Use certified 84 µS/cm and 1,413 µS/cm standards; add a low-range standard when measuring ultrapure water | Rinse with high-purity water, stabilize the reading, confirm temperature, and record the result against the standard value | Keep the cell wet when specified, rinse after every sample, and inspect the cable and connector for moisture | Bench use; protected laboratory enclosure | Before each batch or at least monthly |
| 2 | Portable laboratory meter for drinking-water and field verification | 0.1 µS/cm to 100.0 mS/cm | 0.1 µS/cm to 0.1 mS/cm, depending on range | ±1.0% of reading | Automatic, normally 0–60°C | Two-point calibration with 84 µS/cm and 1,413 µS/cm standards | Measure a fresh sample in a clean container; gently agitate without creating bubbles and wait for a stable value | Rinse with deionized water, dry the exterior, replace the cap, and remove salt deposits with manufacturer-approved cleaning solution | Typically IP67 for field versions | Weekly during routine field use |
| 3 | Industrial handheld meter for process water and wastewater | 0.01 mS/cm to 200.0 mS/cm | 0.01 mS/cm | ±1.0% of reading plus cell error | Automatic, approximately 0–100°C | Calibrate near the expected sample value using 1,413 µS/cm or 12.88 mS/cm standard | Flush the sensor, remove trapped air, measure after thermal equilibrium, and compare with a control sample | Clean electrodes after oily or biological samples; check for coating, cracked insulation, and damaged O-rings | Usually IP67 or IP68, depending on configuration | Weekly to monthly, based on contamination |
| 4 | TDS and conductivity combination meter for general water treatment | 0–19.99 mS/cm | 1 µS/cm or 0.01 mS/cm | ±2.0% of full scale | Automatic, commonly 0–50°C | Single-point calibration with a certified standard near the normal operating range | Rinse twice with sample water, immerse the probe fully, avoid container walls, and confirm a stable display | Rinse after use, prevent drying when required by the probe design, and replace batteries before leakage occurs | Often IP54 to IP67 | Monthly for stable water; weekly for variable water |
| 5 | Low-cost pocket meter for aquariums, hydroponics, and irrigation | 0.00–6.00 mS/cm | 0.01 mS/cm | ±2.0% of full scale | Automatic, generally 0–50°C | Use 1,413 µS/cm standard; verify with a second standard when accuracy is critical | Rinse the probe, immerse to the marked depth, tap gently to release bubbles, and wait for stabilization | Clean deposits with dilute manufacturer-approved acid solution; never scrape the electrode surface | Commonly IP67 | Before each growing cycle or monthly |
| 6 | High-range meter for brackish water, cooling systems, and saline process water | 0.1 mS/cm to 1,000 mS/cm | 0.1 mS/cm at high range | ±1.0% of reading | Automatic, normally 0–100°C; salinity compensation may be available | Use 12.88 mS/cm and 111.8 mS/cm standards where supported; do not extrapolate beyond the calibrated range | Rinse thoroughly after measurement, allow the sensor to equilibrate, and compare with a laboratory reference sample | Remove scale with a compatible descaling procedure, inspect the cell constant, and keep connectors free of salt crystals | Typically IP67 or IP68 | Weekly in saline service |
| 7 | Inline or panel conductivity transmitter for continuous monitoring | 0.055 µS/cm to 2,000 mS/cm, sensor-dependent | 0.1% of selected range | ±0.5% of reading after proper installation | Automatic or manual, depending on sensor and transmitter | Verify with a certified standard during scheduled shutdown; confirm the installed cell constant | Compare the transmitter with a calibrated handheld meter using a representative grab sample | Inspect the flow cell, clean the sensor, verify flow rate, check wiring, and review alarm history | Panel or enclosure rating commonly IP65 or higher | Monthly verification; quarterly cleaning |
| 8 | Four-electrode meter for samples with a wide conductivity range | 0.1 µS/cm to 500 mS/cm | 0.1 µS/cm to 0.1 mS/cm | ±0.5–1.0% of reading | Automatic, approximately 0–100°C | Perform two- or three-point calibration across the expected measurement range | Rinse between standards, use sufficient immersion depth, and confirm that readings stabilize before recording | Clean all electrode surfaces, inspect for fouling between electrode bands, and store according to sensor instructions | Portable versions commonly IP67 | Monthly or after heavy fouling |
| 9 | Pure-water monitoring meter for reverse-osmosis and deionization systems | 0.055–1,000 µS/cm | 0.001 µS/cm at the lowest range | ±0.5% of reading or ±0.1 µS/cm | Automatic, typically 0–80°C | Use low-conductivity certified standards and verify the temperature sensor before calibration | Measure after adequate system flushing; avoid measuring stagnant water and record temperature with conductivity | Flush the flow path, replace fouled cartridges, inspect tubing for leaks, and protect the cell from contamination | Inline housings commonly IP65 or higher | Daily trend check; monthly calibration verification |
| 10 | Rugged multiparameter meter for environmental water surveys | 0–200 mS/cm | 1 µS/cm or 0.01 mS/cm | ±1.0% of reading | Automatic, generally 0–60°C | Calibrate with a standard close to the expected field conductivity; verify temperature before deployment | Rinse with site water, measure upstream of disturbed sediment, allow stabilization, and take duplicate readings | Rinse with clean water after each site, remove biological growth, inspect the probe guard, and charge batteries safely | Usually IP67 or IP68 | Before each survey and after field damage |